Indication for and Effect of Adjuvant Chemotherapy for Stage IIa (T3N0M0) Colon Cancer
Article information
Abstract
Purpose
The efficacy of adjuvant chemotherapy (AC) in stage IIa colon cancer is controversial. This study aimed to investigate the factors influencing survival in patients with stage IIa colon cancer, the role of AC, and the indications for AC utilization by surgical oncologists.
Methods
Between January 2004 and December 2010, 736 patients with stage IIa colon cancer underwent curative resection in 1 of 6 participating hospitals. Factors related to survival were identified and analyzed according to whether AC was administered or not. After high- and low-risk groups were identified, their respective results were analyzed.
Results
The 5-year overall survival (OS) of stage IIa colon cancer was 90.3%. With the exception of poorly differentiated histology, indications for AC did not include typical high-risk factors. The indications for AC were significantly younger patients, higher body mass index (BMI), lower American Society of Anesthesiologists (ASA) physical status classification, and higher histologic grade. BMI, preoperative carcinoembryonic antigen, and harvested lymph node (LN) count were significant factors for disease-free survival, while BMI and ASA physical status classification were significant factors for OS in the chemotherapy group. In the high-risk group, AC was associated with increased OS in univariate analysis. BMI and harvested LN count were statistically significant in multivariate analysis.
Conclusion
Surgical oncologists consider the patient’s condition and postoperative course rather than high-risk factors to determine use of AC. Regardless of AC use, both the extent of surgery and the patient’s subsequent status affected the survival rate in the high-risk group. None of the factors identified influenced survival rate in the low-risk group.
INTRODUCTION
The majority of patients with colon cancer are stage II or III at diagnosis; of these, 30%–40% are stage II colon cancer (T3/ T4N0M0) [1, 2]. Fluorouracil (5-FU) based adjuvant chemotherapy (AC) for stage III colon cancer improved 5-year survival rates [3]. However, AC remains controversial for patients with stage II colon cancer. Patients with stage II colon cancer have good prognosis, with an overall survival (OS) rate higher than 60%–80% [4, 5]. Previously, the OS benefit in stage II colon cancer treated with AC was not prominent [6, 7]. However, other studies have shown that 5-FU treatment improves survival for patients with stage II colon cancer. The National Surgical Adjuvant Breast and Bowel Project group reported a 30% reduction in mortality, and subgroup analysis showed significant benefits in groups with poor prognoses [8].
Surgical oncologists in other gastrointestinal groups occasionally judge the surgical and pathologic stages differently and determine chemotherapy use accordingly [9]. The opinion of the operating surgeon is essential in evaluating a patient’s cancer status. Similarly, colorectal surgical oncologists may consider a patient’s peri-operative status and postoperative course in determining use of AC.
The purpose of this study was to develop criteria to aid surgical oncologists with decisions regarding the use of AC, to investigate factors affecting the survival rate of stage IIa colon cancer, and to understand the role of chemotherapy in high- and low-risk groups.
METHODS
Between January 2004 and December 2010, patients underwent curative resection in one of 6 hospitals (Seoul St. Mary’s Hospital, Yeouido St. Mary’s Hospital, Uijeongbu St. Mary’s Hospital, Incheon St. Mary’s Hospital, St. Vincent’s Hospital, Daejeon St. Mary’s Hospital College of Medicine) within the Catholic Medical Center and were enrolled in this study. Of 1,785 patients with stage II and III colon cancer, 736 patients with stage IIa (T3 N0M0) colon cancer were prospectively collected in the CMC colorectal cancer database, and survival outcomes were confirmed via retrospective chart review.
Histologic stage was based on the 7th American Joint Committee on Cancer/Union for International Cancer Control TNM classification. A specialized colorectal surgeon performed all operations and administered chemotherapy. Clinical data were recorded in detail, including patient demographic information, operation data, morbidity, pathology, recovery, recurrence, and survival. Tumor location was classified as cecum, ascending colon, hepatic flexure, transverse colon, splenic flexure, or sigmoid colon. The high-risk group was determined by the presence of at least one of the following factors: obstruction and/or perforation, lymphatic invasion, vascular invasion, perineural invasion, positive margins, poorly differentiated histology, and less than 12 harvested LNs. The low-risk group was defined by absence of the above risk factors, and the high-risk group consisted of patients with one or more of these risk factors.
Surgical oncologists made decisions regarding AC using clinical judgement following curative resection. A surgical oncologist was defined as a surgeon who provides surgery and AC. General performance, pathologic features, and postoperative condition of the patient were considered. AC was usually a 6-month course of 5-FU based treatments. All patients were continuously followed after surgery. During the initial year following surgery, follow-up was performed at 3-month intervals. This was followed by 6-month intervals for 3 years following surgery and then a 1-year interval for final follow-up. Follow-up examinations included physical examination, rectal examination, carcinoembryonic antigen (CEA) level, chest X-ray, abdominal ultrasonography, abdominal computed tomography (CT), and colonoscopy.
When recurrence was suspected, chest CT and positron emission tomography-CT were performed. Recurrence was defined as histologic confirmation at the recurrence site or increased lesion size and deterioration of the lesion.
Follow-up results up to February 2015 were included in this study. The Institutional Review Board (IRB) number of this study is XC15RIMI0038-KSUOVD. The IRB waived informed consent for this study.
Statistical analysis
Differences between categorical variables were analyzed using the chi-square test. The prognostic significance of demographic and pathologic characteristics was determined using univariable and multivariable Cox proportional hazard regression analyses.
Statistical analyses were performed using IBM SPSS ver. 18.0 (IBM Co., Armonk, NY, USA). A Kaplan-Meier survival curve was constructed, and the log-rank test identified statistically significant differences in survival. Variables that reached statistical significance (P < 0.05) were entered into a multivariate analysis, which was performed using the Cox proportional hazard model. In all cases, P-values less than 0.05 were considered statistically significant.
RESULTS
Patient characteristics
The median follow-up of the whole group was 56.5 months (range, 1–130 months). Of 736 patients with stage IIa colon cancer (T3N0M0) who underwent curative resection, 534 patients (72.6%) received 5-FU based AC, and 202 patients (27.4%) only received surgery. At the time of diagnosis, median age was 64.5 ± 12.1 years, 284 patients (38.6%) were over 70 years old, and 428 patients (58.2%) were male. Preoperative CEA was 9.58 ± 39.03 ng/mL
In the chemotherapy group, patients were significantly younger and had higher BMI, lower American Society of Anesthesiologists (ASA) physical status classification, lower postoperative complications, higher histologic grade, and shorter hospital stay. Vascular invasion was higher in the surgery-only group.
There was no significant difference in factors of the high-risk group except for poorly differentiated histology. The proportion of patients in the high-risk group was not different between the AC and non-AC groups (59.4% vs. 59.4%, P = 0.99) (Table 1).
Cancer-related survival & prognostic factors
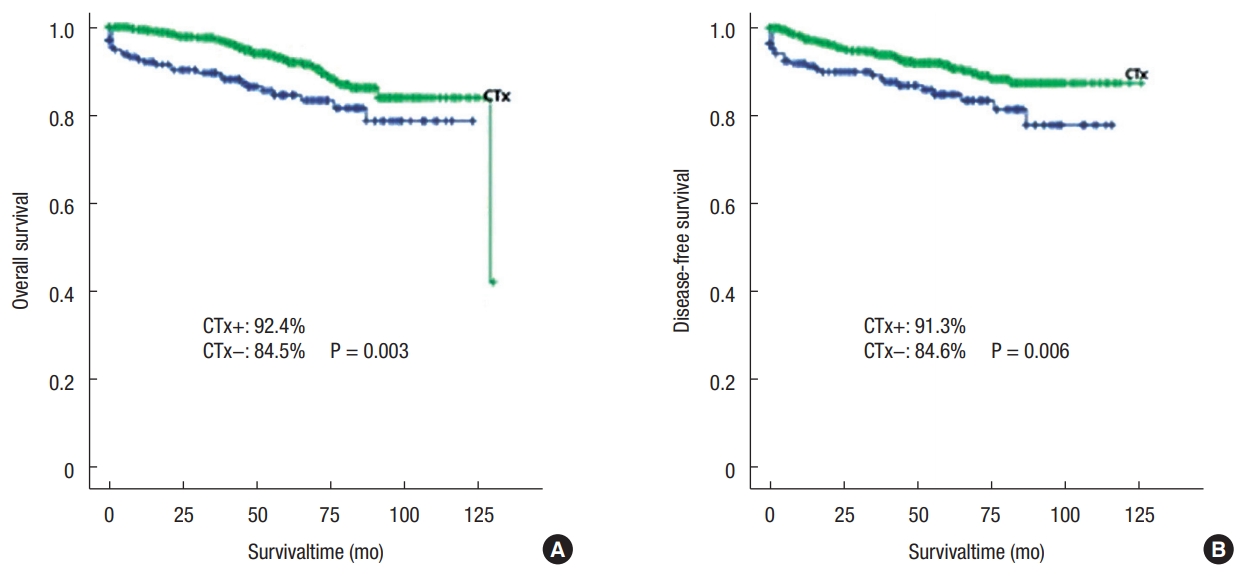
Five-year OS was 90.1%, and DFS was 90.3%. For those receiving chemotherapy (CTx), the difference in OS (CTx+: 92.4% CTx−: 84.5%, P = 0.003) and DFS (CTx+: 91.3% CTx−: 84.6% P = 0.006) was confirmed (Fig. 1).
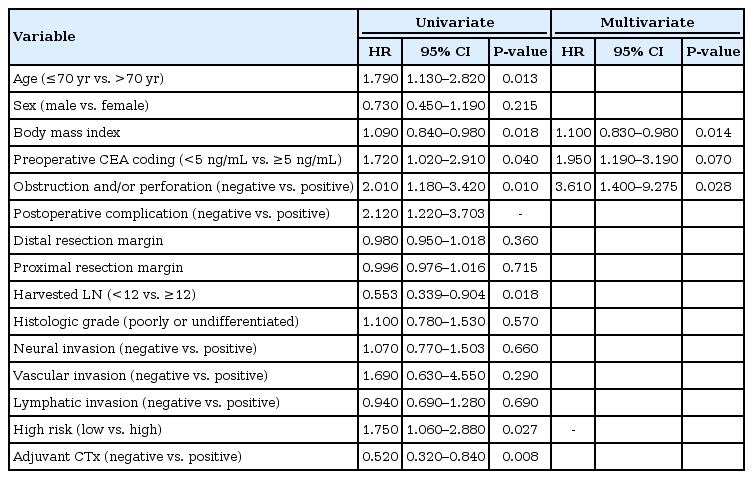
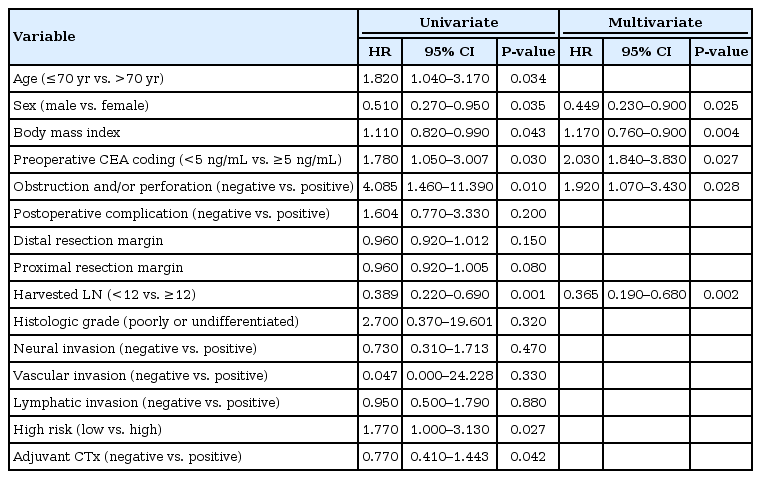
Univariate analysis of prognostic factors that might affect survival was performed. Younger age and AC had a positive effect on survival, while higher BMI, preoperative CEA above 5 ng/mL, obstruction and/or perforation, fewer than 12 harvested LNs, and high-risk group had a negative effect on either DFS or OS. Postoperative complications affected DFS, and male sex affected OS.
In the multivariate analysis, older age, higher BMI, and obstruction and/or perforation had a negative impact on DFS. Male sex, higher BMI, preoperative CEA above 5 ng/mL, obstruction and/ or perforation, and fewer than 12 harvested LNs had a negative impact on OS. The results of univariate analysis showed that high-risk characteristics were substantial predictors of DFS and OS. AC was also a significant predictor of DFS and OS in univariate analysis, but not in multivariate analysis (Tables 2, 3).
Chemotherapy-related survival & prognostic factors
Patients were divided into an AC group (534 patients, 72.6%) and a surgery-alone group (202 patients, 27.4%) according to their treatment path.
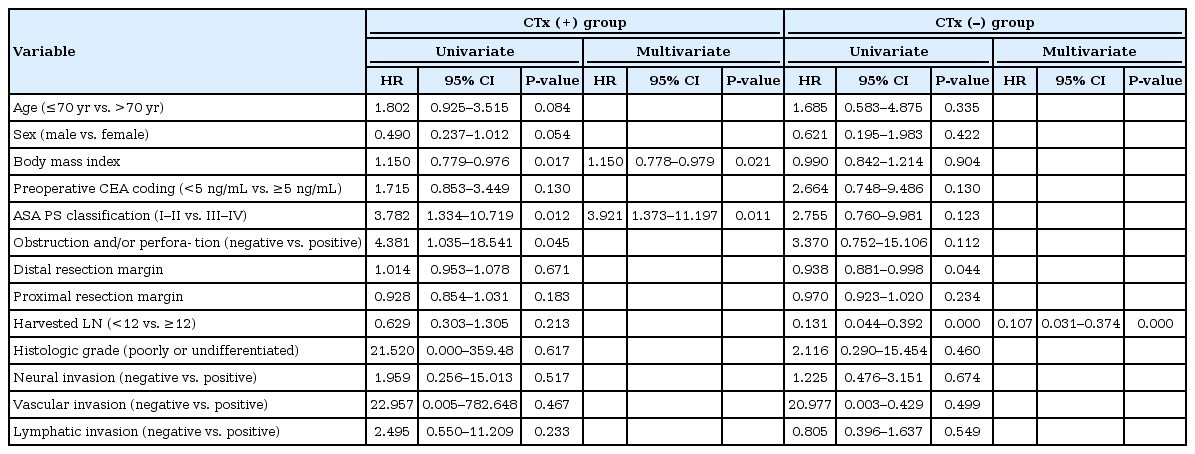
In the chemotherapy group, BMI (hazard ratio [HR], 1.18; 95% confidence interval [CI], 0.7–0.95; P = 0.040), preoperative CEA (HR, 2.02; 95% CI, 1.17–3.46; P = 0.011), distal resection margin (DRM) (HR, 0.926; 95% CI, 0.87–0.97; P = 0.006), and harvested LN count (HR, 0.96; 95% CI, 0.94–0.99; P = 0.040) were significant predictors of DFS. BMI (HR, 1.15; 95% CI, 0.78–0.98; P = 0.021) and ASA physical status classification (HR, 2.02; 95% CI, 1.37–11.20; P = 0.011) were significant predictors of OS.
In the surgery-alone group, ASA physical status classification (HR 3.42; 95% CI, 1.06–11.03; P = 0.039) was a significant predictor of DFS, while harvested LN count (HR 0.107; 95% CI, 0.031–0.374; P < 0.001) was a significant predictor of OS (Tables 4, 5).
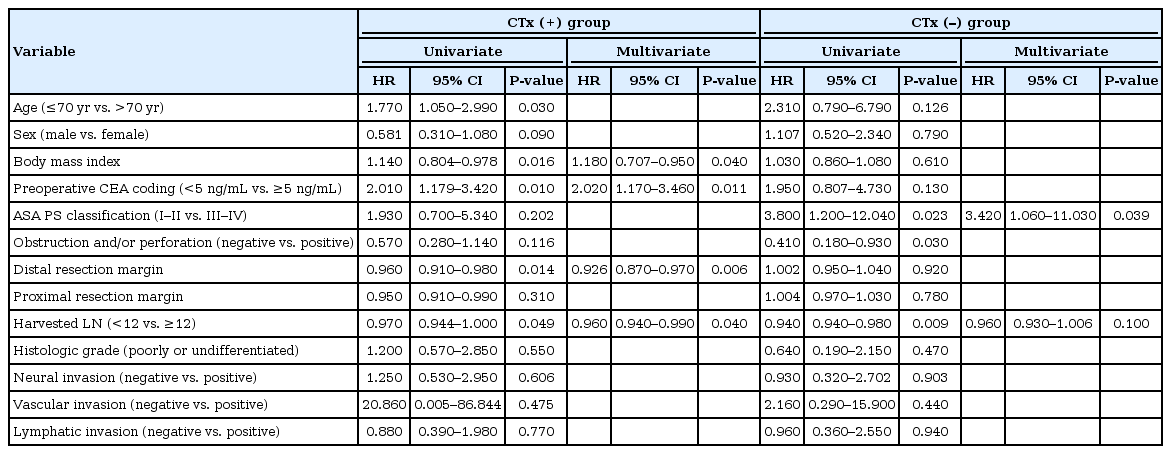
Univariate and multivariate analysis with variables affecting disease-free survival in CTx (+) group and CTx (–) group
Cancer-related survival in high-risk vs. low-risk groups
Factors related to OS and DFS were identified in the high-risk group (n = 436, 59.2%) and low-risk group (n = 300, 40.8%).
In univariate analysis of the high-risk group, age, BMI, ASA physical status classification, harvested lymph node (LN) count, and AC were significant predictors of OS. Among these factors in multivariate analysis, BMI (HR, 1.37; 95% CI, 0.61–0.86; P < 0.000) and harvested LN count (HR, 0.94; 95% CI, 0.89–0.98; P = 0.017) had a significant effect on OS.
AC was a significant predictor of OS in univariate analysis in the high-risk group, but this effect was only a trend in multivariate analysis (HR, 0.59; 95% CI, 0.33–1.07; P = 0.086). In the low-risk group (300 patients, 40.8%), there were no significant associations observed in the multivariate analysis. There were no statistically significant predictors of DFS within the high-risk and low-risk groups (Tables 6, 7).

Univariate and multivariate analysis according to variables affecting disease-free survival in high-risk and low-risk groups
DISCUSSION
Kumar et al. [10] recommend adjuvant treatment for patients with stage II colon cancer if there are inadequately sampled nodes, T4 lesions, perforation, or poorly differentiated histology. Microscopically, chemotherapy destroys cancer cell deposits and possibly eliminates hidden metastasis. This recommendation may also be beneficial due to other lesser-known factors. For example, good baseline prognosis in the stage II group, noncancer related death in elderly patients, and inappropriate staging due to improper node resection suggest that the benefit of AC may be masked [10, 11].
One study of radically resected stage pT3-pT4b gastric cancers suggests that there may be a discordance between surgical stage and pathologic stage, and surgical stage may be an independent factor affecting OS. Surgical T stage is a significant and independent prognostic index of OS in patients with radically resected advanced gastric cancer [9]. Based on these results, the operating surgeon’s opinion is essential in evaluating a patient’s cancer status.
In a previous study, overall 5-year survival for patients with T3N0 cancer was 60%–80% [4, 5]. The results of this study found significantly higher rates for 5-year OS (90.1%) and DFS (90.3%) compared to previous studies. The surgical oncologist in our study used AC and wanted to determine characteristics of the group, which could have resulted in these differences. However, the scientific evidence for this hypothesis is weak and needs further study.
In the present study, the chemotherapy group was significantly younger and had higher average BMI, lower ASA physical status classification, lower postoperative complications, and higher histologic grade than the surgery-alone group. These findings differ from generally known high-risk factors, and surgical oncologists in our study were less likely to use high-risk factors and more likely to consider the patient’s intraoperative and postoperative conditions in determining AC use. Considering that DRM and less than 12 harvested LNs are significant factors, incomplete curative resection is one factor considered in determining the use of AC.
Surgical oncologists have the advantage of evaluating a patient’s condition directly in the operating room while performing surgery, which is different from reported pathologic results and studies such as ascites tumor maker analysis [12]. In addition, patients are observed during the recovery period after surgery, and AC is decided on by careful consideration of the patient’s condition after an outpatient visit. Therefore, these encounters are advantageous for surgical oncologists performing AC.
Factors affecting survival rate in the chemotherapy group were BMI, preoperative CEA, and harvested LN counts. CEA is often recommended as a prognostic factor with preoperative testing, and elevated CEA is associated with poor prognosis [13]. In this study, elevated CEA levels above 5 ng/mL also significantly affected survival rate in multivariate analysis.
Harvested LN count is affected by anatomical structure, resection range, and surgical technique, which are considered surrogates for complete resection of tumor bearing tissue. The 5-year survival rate of the National Cancer Database for T3N0 colon cancer with 35,787 cases was 64% (1–2 LN examined) and 86% (>25 LN examined), and there was also a 5-year survival rate difference according to classification of LN harvest count (1 to 7, 8 to 12, 13 or more). The mean number of LNs examined in this study was 21.36 ± 12.72, and 152 patients (20.7%) had less than 12 harvested LNs. Survival rate was negatively impacted when less than 12 LNs were harvested.
Recurrence after curative operation may be due to micrometastasis at the time of surgery. AC aims to increase the cure rate by reducing micrometastasis. In stage III cancer, AC is reasonable and logical due to LN infiltration. It is important to identify poor prognostic factors associated with latent micrometastasis in stage II. This study suggests that risk factors for lowering survival rate are preoperative CEA above 5 ng/mL, obstruction and/or perforation, and fewer than 12 harvested LNs. Although multivariate analysis showed that AC was not an independent factor, further study is needed because of the tendency noted in the high-risk group.
In conclusion, surgical oncologists in our study tend to consider a patient’s perioperative condition and postoperative status rather than high-risk factors when determining AC use. AC might be considered for patients in the high-risk group, but this study did not show significant effects in multivariate analysis. More large volume and prospective studies are needed to further address this issue with strong evidence.
Notes
CONFLICT OF INTEREST
No potential conflict of interest relevant to this article was reported.


