


INTRODUCTION
Colon cancer is one of the most common types of cancers and one of the primary causes of cancer death [1].
Surgery is the main treatment for colon cancer. The primary determinants of prognosis are presence of distance metastasis and pathological tumor (pT) stage including local lymph node involvement. The most widely used staging system is the TNM classification of malignant tumors. Many of its features have been considered by the American Joint Committee on Cancer (AJCC)/ the Union for International Cancer Control (UICC) [2, 3], although its validity has been debated [4-6]. The AJCC/UICC guidelines for colon cancer are founded on more than 20-year-old recommendations based on level III to IV evidence [7]. These recommendations concluded that, to achieve an accuracy of > 90%, a minimum lymph node yield of 12 negative lymph nodes is needed to guarantee lymph node-negative disease in colon cancer [7]. Despite these guidelines, debate remains regarding the optimal lymph node yield to guarantee proper staging [5, 6]. Moreover, subsequent studies have demonstrated that patient-related and histopathological factors including sex, age, tumor location, body mass index, pT category, and elective vs. acute surgery seem to influence the risk of stage III disease in colon cancer [8-12]. Although most countries have accepted the guideline of 12 lymph nodes, recent national cohorts fulfill the 12 lymph node recommendation in only a limited number of patients [11, 13, 14].
The overall aim of this study in a high-quality national cohort with nonmetastatic colon cancer was to identify possible patient-and tumor-related factors associated with risk of stage III disease.
METHODS
Since May 2001, when the Danish Colorectal Cancer Group (DCCG) established a nationwide database, all patients aged 18 years or older with a first-time diagnosis of colorectal adenocarcinoma treated in any Danish colorectal surgical department have been prospectively recorded. Patients are identified by unique civil registry numbers, which have been allocated by the Central Population Registry to all Danish citizens since 1968. Data are provided by surgical departments and include demographics, tumor location, tumor category, diagnostic and therapeutic procedures, and postoperative complications. The completeness of data collection in the DCCG database is estimated annually and has improved from 86.4% to 96.7% in the study period of 2001 to 2011 [15]. The high completeness is achieved through linkage to the Danish National Patient Register.
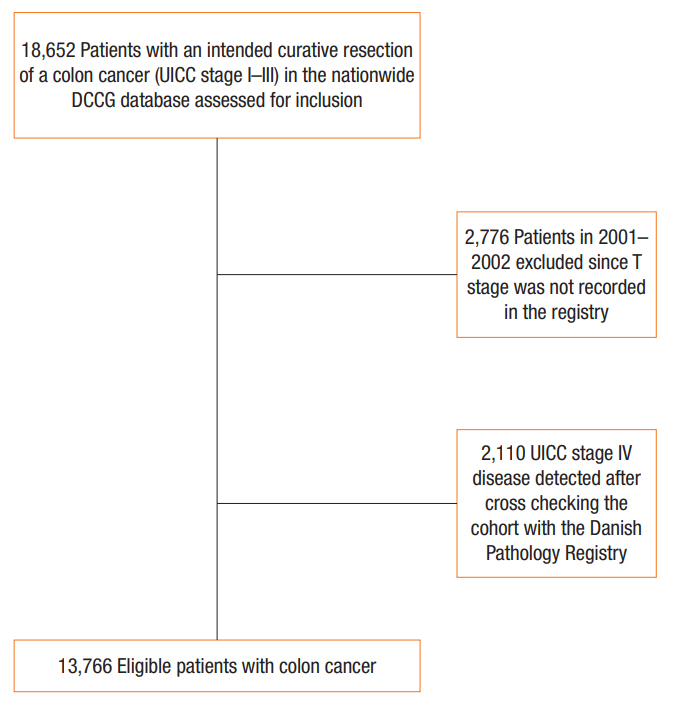
In our study cohort, the DCCG database and the Danish Pathology Registry were used for data extraction and analyses. Histopathology of the primary tumor was extracted from the Danish Pathology Registry. Variables of age, sex, tumor location, pT category, N category, open vs. laparoscopic surgery, acute vs. elective surgery, and lymph node yield were extracted for use in the present study. The Dukes classification was standard for staging patients with colorectal cancer in Denmark in the first 2 years of the database (2001 to 2002) [15]. Since this method does not specify pT category, patients from that period were excluded. Only patients with a first-time diagnosis of colon cancer and subsequent curative colon resection, defined as R0-resection of stage I to III adenocarcinoma located at least 15 cm beyond the anal verge, were included. Data from Jan 1, 2003 to December 31, 2011 were included.
The study was approved by the Danish Data Protection Agency (No. 2000-53-0073). Data were accessed and analyzed on secured servers from Denmark’s Statistics. Due to Danish legislation, informed consent is not needed in a register-based research project with anonymized data [16]. In Denmark, all patients with colon cancer are treated in public hospitals.
The risk of stage III disease was analyzed according to sex, priority of surgery, type of surgery, 3 groups defined by age, 4 groups determined by lymph node yield, and tumor location. Colon cancer localization was described according to site; right-sided colon cancer (cecum, ascending colon, hepatic flexure, and transverse colon) and left-sided colon cancer (from splenic flexure to sigmoid colon, both included) and to specific subsites (cecum, ascending colon, hepatic flexure, transverse colon, splenic flexure, descending colon, and sigmoid colon). The border between the sigmoid colon and rectum was defined as 15 cm from the anal verge.
The associations between stage III disease and year of diagnosis, pT category, age (3 groups), lymph node yield (4 groups), sex, open vs. laparoscopic surgery, acute vs. elective surgery, rightsided vs. left-sided colon cancer, and tumor subsites were explored using multiple logistic regressions with lymph node positivity as an independent variable. Data was reported as odds ratio (OR) with 95% confidence interval (95% CI). For age, lymph node yield, and pT category, each level of the variable was compared with the preceding level.
Data were analyzed using IBM SPSS ver. 22.0 (IBM Corp., Armonk, NY, USA). Patient characteristics and tumor-related data were analyzed by Pearson chi-square test. Data are described as median and interquartile range (IQR). A P-value of < 0.05 was used as the level of significance in all analyses.
RESULTS
Patient characteristics
Data from 13,766 patients (male, 48.7%) with radical resection of stage I to III colon cancer were available for the analysis (Fig. 1). The median age was 70 years (IQR, 62 to 78 years), and median lymph node yield was 15 (IQR, 11 to 22). A total of 37.5% of patients had stage III disease (Table 1).
Univariate analyses
No difference in percentage of stage III disease was observed according to sex (Table 1). Proportion of stage III disease decreased significantly with increasing age (Table 1). No significant difference in proportion of stage III disease was observed for right-sided vs. left-sided colon cancers (Table 1).
Tumors in the cecum, splenic flexure, and descending colon had the highest risk of stage III disease, with 39.7% to 40.2% of cases having stage III disease. Tumors in the ascending colon, hepatic flexure, transverse colon, and sigmoid colon had a risk of stage III disease ranging from 36.5% to 36.8% (P= 0.009). A significant association between increasing pT category and stage III disease was observed over a range from 12.4% in pT1 tumors to 56.2% in pT4 tumors (P < 0.001). A significantly different proportion of stage III disease was observed in the group of patients who underwent acute operation (48.8%) compared to those who underwent elective operation (35.8%) (P < 0.001). The proportion of patients with stage III disease was 38.7% in laparoscopic surgery compared with 34.6% in open surgery (P< 0.001). Finally, a significant difference in percentage of stage III disease in the 4 lymph node yield groups was observed, ranging from 22.2% (lymph node yield, 0 to 5) to 40.8% (lymph node yield, ≥ 18) (P< 0.001) (Table 1).
Multivariate analysis
In multivariate logistic regression analysis, age, lymph node yield, pT category, tumor site (left vs. right), and priority of surgery were all independently associated with stage III disease. Moreover, year of diagnosis was independently associated with stage III disease, and a decline in the risk of stage III disease was observed throughout the study period. No association was found between stage III disease and either sex or type of surgery. The ORs for stage III disease are shown in Table 2.
Further multivariate analysis included tumor localization by 7 tumor subsites. In this analysis, tumors of the sigmoid colon were chosen as the reference value since such tumors were found to present the lowest risk of stage III disease in univariate analysis. In this analysis, only tumors in the transverse colon were independently associated with lower risk of stage III disease. There was no difference in risk of stage III disease between tumors in the sigmoid colon and tumors in the remaining tumor subsites (Table 3).
DISCUSSION
The aim of this study was to investigate issues concerning diagnosis of stage III disease in colon cancer. We found an association between lymph node yield from a colon cancer specimen and occurrence of stage III disease. An independent association was also found between increasing lymph node yield and probability of detecting stage III disease up to a lymph node yield of 12 to 17, in accordance with present guidelines.
A declining risk for stage III disease was observed with increasing age. The reason for this association is unknown, but it has been proposed that elderly patients are under-staged as a consequence of insufficient lymph node harvest due to less extensive resection [8, 17, 18]. Nevertheless, in our multivariate analysis, increasing age was independently associated with decreasing risk of stage III disease, indicating that under-staging may only be part of the explanation. Another possible explanation is that colon tumors in elderly patients behave less aggressively than those in younger patients, as proposed by others [19]. Unfortunately, such data were not available for our analysis.
An increasing rate of stage III disease was observed with more advanced pT stage. This relationship remained significant in multivariate analysis. It seems reasonable that more invasive tumors are more prone to disseminate to the lymphovascular system, including lymph nodes, than less invasive tumors. This is supported by other studies [13, 20].
It has previously been proposed that right-sided colon cancers differ from left-sided colon cancers and more often present with stage III disease [20]. Subsequent studies have proposed that this difference depends on patient- and tumor-related characteristics [20-24]. Results from our study question these findings since no difference in rate of stage III disease was observed in the right-sided vs. left-sided colon cancers in univariate analysis. However, multivariate analysis identified a significant, although minor reduced risk of stage III disease in right-sided colon cancers compared to left-sided colon cancers.
When analyzing the percentage of cases with stage III disease according to tumor subsite, tumors in the cecum, splenic flexure, and descending colon had the highest risk of stage III disease (ranging from 39.7% to 40.2%) compared to tumors in the ascending colon, hepatic flexure, transverse colon, and sigmoid colon (ranging from 36.5% to 36.8%) (P= 0.009).
These findings are supported by other studies in which the cecum and splenic flexure had the highest risk of stage III disease [20]. There are several potential explanations for our findings. Endoscopic accessibility is proposed to differ according to colon subsite, and lesions located at the flexures are especially difficult to detect [25]. Therefore, tumors at these subsites may be detected at a more advanced stage than tumors in other parts of the colon. Moreover, there is an unknown rate of incomplete colonoscopy in which parts of the right side of the colon/cecum are not fully visualized due to endoscopic difficulties and incomplete bowel preparations [25]. Therefore, a number of right-sided tumors will not be detected before they cause clinical symptoms. Other studies have shown that colonic transit time and fecal exposure time in different colon subsites are associated with risk of stage III disease [20, 26].
In a multivariate analysis, only tumors in the transverse colon had an independent reduced risk of stage III disease, although minor, compared to those in the sigmoid colon, which had the lowest risk of stage III disease in univariate analyses. These results indicate that tumor subsite alone is not independently associated with risk of stage III disease.
When acute surgery was compared to elective surgery, there was significantly more acute surgery performed in patients with stage III disease. In the multivariate analysis, this difference remained significant. The main reasons for acute surgery for colon cancer are ileus or perforation. Large bulky tumors present more often with ileus and perforations than small tumors, and it is likely that large tumors have a higher risk of disseminating to local lymph nodes than small tumors. Our findings emphasize that patients who present with acute colon cancer are high-risk patients who require a skilled surgical team to ensure sufficient resection.
A decrease in risk of stage III disease during the data collection period was observed. Thus, year of diagnosis was an independent prognostic factor for risk of stage III disease. The exact reason for the decrease in risk of stage III disease over time in Denmark is unknown. Since the year 2000, a range of national initiatives including programs for early detection of colon and rectal cancer has been launched in Denmark to improve the prognostic outcome for patients with colorectal cancer. It is likely that these initiatives, orchestrated by the DCCG, together with a uniform healthcare system managed centrally by the National Board of Health, have contributed to better detection of patients with colon cancer.
It is likely that a standardized immune score system will be an integrated part of the colon cancer staging system when this system is fully developed [27]. It is unknown if a large lymph node yield will still be required for correct diagnosis after introduction of such an immune score system.
Lymph nodes, including T-cell activated lymph nodes, are a central part of the immune system, and activated T-cells are key to elimination of cancer cells. Further research is needed to understand how removal of T-cell activated lymph nodes influences tumor–immune interactions in colon cancer. Nevertheless, it seems likely that staging based on an immune score can reduce the need for a large lymph node harvest and save some T-cell activated lymph nodes to fight cancer. A staging system based on tumor– immune interactions may allow more precise identification of low- and high-risk cancers that will increase the possibility of identifying patients who will benefit from adjuvant therapy. More precise staging will increase the opportunity for less extensive resections or even allow local resections (organ-preserving resections). This will reduce the risk of surgical complications and possible side effects of extensive resection.
The current analysis has several positive attributes in addition to the fundamental strength of its national population-based design. The study included patients from all Danish departments conducting colon surgery during the study period. It was further strengthened by an almost complete and unselected compilation of data merged from 2 different population-based national registers. Moreover, patients received uniform treatment since treatment of colon cancer in Denmark was standardized following recommendations by the DCCG.
There are some limitations to the present study. Since this is an observational study, we cannot describe causal relationships but only associations. Second, we did not have data on molecular and genetic features of tumors, denying us the ability to draw any conclusions concerning the possible association between molecular and genetic characteristics of tumors and stage III disease. Thirdly, we did not have any data on the subspecialty of surgeons, which might explain acute surgery as an independent predictor.
Despite these limitations, we analyzed a national unselected cohort with > 95% data completeness and found that the risk of stage III disease in colon cancer is associated with age, pT stage, and tumor subsite. Moreover, a minimum of 12 negative lymph nodes, as recommended in the current guidelines, is needed to ensure correct diagnosis of lymph node-negative disease. Our study did not reproduce previous findings indicating that right-sided colon cancers present with stage III disease more often than left-sided colon cancers. Finally, our study confirms that patients presenting with acute colon cancer are at high risk of stage III disease compared to those operated on in an elective setting.
Based on preoperative data of age, tumor subsite, and preoperative staging, it might be possible to tailor resection for patients with colonic cancer in the future.